
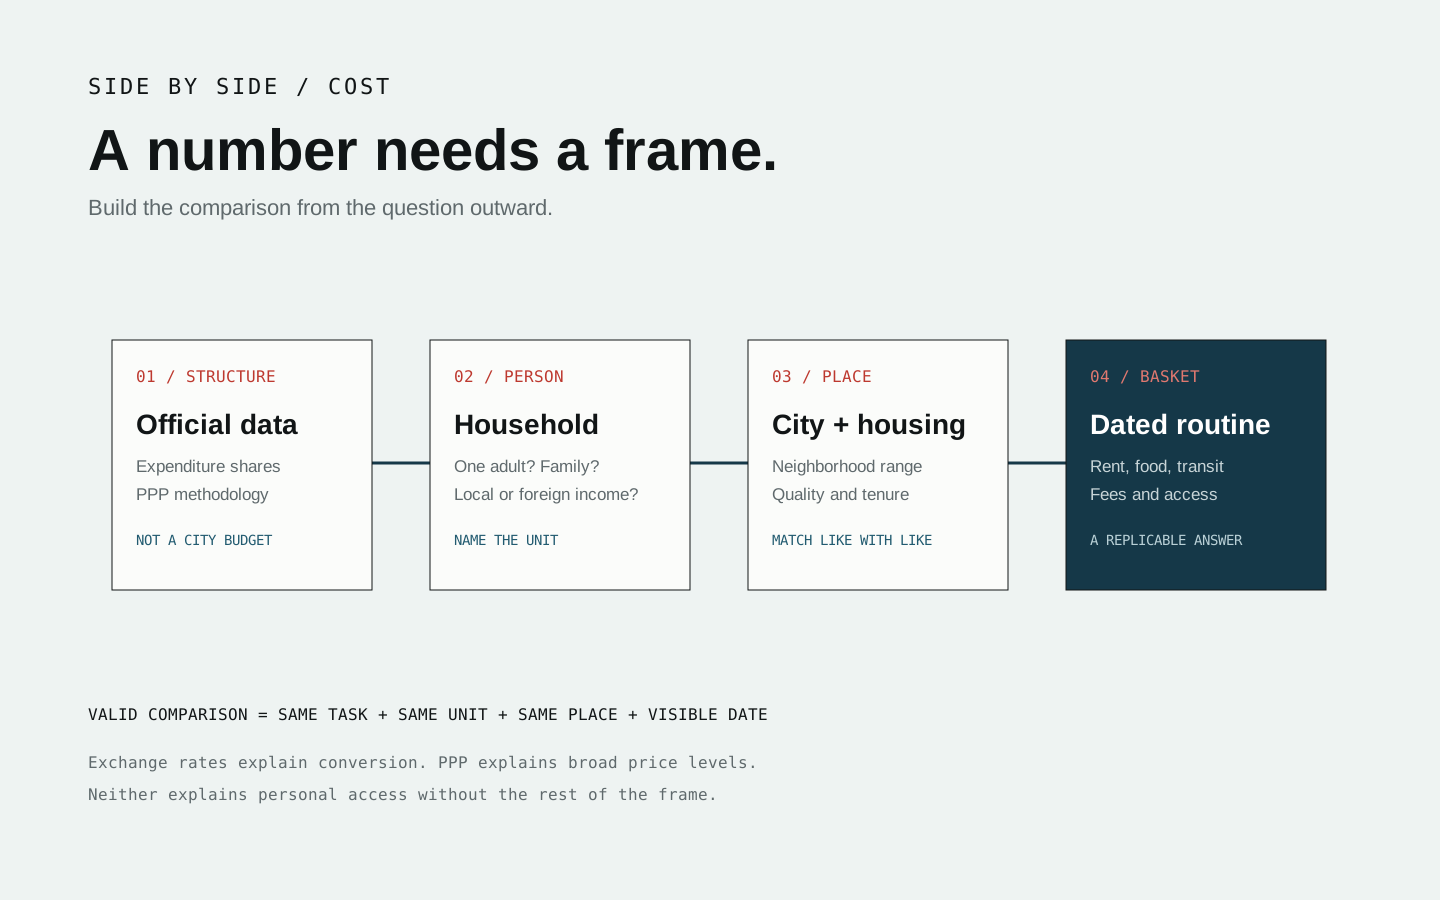
“Is China cheaper than the United States or Europe?” sounds specific because it contains three places and a price question. It is not specific enough to answer.
A student renting a room in Wuhan, a family paying for childcare in Shanghai, a retired couple in Ohio and a single worker in Paris do not inhabit comparable budgets. A useful comparison begins only after the person, city, date and task are named.
Four numbers that look alike but are not
Official statistical systems publish strong data, but the measures do different jobs.
| Measure | What it can show | What it cannot show alone |
|---|---|---|
| Household expenditure total | How a surveyed household population spends across a year | Your budget in a named city |
| Expenditure share | Which categories consume more or less of a household budget | Whether the housing or service quality is equivalent |
| Price-level or PPP index | Relative national price levels for a common reference framework | Today’s rent or lunch price in one neighborhood |
| Collected city basket | What selected items cost at a stated place and date | A universal standard of living |
China’s National Bureau of Statistics reports national per-capita household income and expenditure. The U.S. Bureau of Labor Statistics reports consumer expenditures for consumer units. Eurostat compares household-consumption price levels across European countries. The World Bank’s International Comparison Program constructs purchasing-power parities for economies.
Putting the headline totals in one row would be visually easy and analytically wrong. The unit may be per person in one series and per consumer unit in another. Survey definitions, category boundaries, currencies and price years differ.
A real example, with the denominator left attached
The point of using official data is not to decorate a page with large numbers. It is to preserve what each number describes.
| Published series | Headline total | Selected category results | Denominator and warning |
|---|---|---|---|
| China NBS, 2025 | RMB 29,476 annual consumption expenditure | Food, tobacco and liquor: RMB 8,631 (29.3%); residence: RMB 6,397 (21.7%); transport and communication: RMB 4,306 (14.6%) | Per person, nationwide. Categories combine items differently from the U.S. series and are not a Shanghai or Wuhan budget. |
| U.S. BLS, 2024 | $78,535 annual expenditure | Housing: $26,266; food: $10,169; transportation: $13,318; healthcare: $6,197 | Per consumer unit, averaging 2.4 people and 1.3 earners—not per person. |
| Eurostat, 2025 | EU average = 100 price-level index | Overall household-consumption prices: Denmark 140, Ireland 136, Luxembourg 132; Bulgaria 63, Romania 65, Poland 73 | Relative price levels, not spending totals and not adjusted for wages or household income. |
The U.S. category shares, calculated directly from the published BLS totals, are about 33.4% for housing, 13.0% for food and 17.0% for transportation. Those percentages still should not be placed against China’s categories as if the definitions were identical: China’s food group includes tobacco and liquor, while its transport group includes communication. We show the calculation because it is reproducible, and the mismatch because it matters.
Europe is especially easy to flatten. Eurostat’s 2025 index places overall household-consumption prices from 140% of the EU average in Denmark to 63% in Bulgaria. The spread changes again by category: housing in Ireland was 190% of the EU average, while Bulgaria was 41%; food and non-alcoholic beverages ranged from 122% in Luxembourg to 80% in Romania. “Europe costs X” is therefore not a useful consumer claim.
Start with shares, then build a task basket
Official expenditure shares can reveal structure: how much of a budget goes to housing, food, transport or health. Even here, category definitions must be checked. “Housing” may treat imputed rent, utilities or owner costs differently.
For a person making a decision, build a city task basket next:
- Name the city and neighborhood range.
- Name the household: one adult, two adults, family with a child, student sharing, or another explicit case.
- Define housing quality and tenure. A room, older walk-up and new serviced apartment are not substitutes because they share a floor area.
- Define a routine: home-cooked meals, public transport, mobile plan, health coverage and a modest social budget.
- Collect prices within a short date window and record tax, fees, deposits and eligibility limits.
The resulting basket is not “the cost of China.” It is a replicable answer to one question.
Currency conversion is necessary but insufficient
Market exchange rates tell you what money converts into. They matter for travelers and people paid in another currency. Purchasing-power measures help compare broader price levels. Neither tells you whether a local salary, visa status or benefit system gives the same access.
A visitor earning dollars may experience a restaurant as inexpensive. A local worker paid in renminbi is making a different affordability calculation. Both observations can be true. The comparison should label the perspective rather than forcing one into the other.
The biggest missing variable is often access
Some costs are prices; others are systems. Health care depends on insurance and provider access. Education depends on residency, public eligibility and family choice. Transport depends on where housing is available relative to work. Digital services may require a local number or identity check.
This is why viral “monthly life in China versus America” videos can be vivid yet incomplete. They show a real person’s basket, which is useful evidence of one life. They do not automatically show a representative household or transferable outcome.
A comparison we will publish
China This Way uses three layers:
- Official structural layer: expenditure shares, price-level methodology and clearly named national statistics, always with the unit attached.
- City task layer: dated prices for a defined routine, collected consistently and shown with the basket.
- Decision layer: rent, commute, food, connectivity and access rules combined for one named traveler or resident profile.
We will not publish a single unsourced score that declares one country cheap. When city baskets are updated, the old date will remain visible so readers can see what changed.
Sources and scope
- World Bank International Comparison Program methodology — what PPPs and international price comparisons are designed to measure.
- National Bureau of Statistics of China: 2025 household income and consumption — RMB 29,476 nationwide per-capita expenditure, its eight category totals and the 160,000-household survey basis.
- U.S. Bureau of Labor Statistics: Consumer Expenditures 2024 — the $78,535 consumer-unit total, household composition and category values used above.
- Eurostat: household consumption price levels in 2025 — the EU-relative country and category price-level indexes used above.
This page provides a method, not a current personal budget. Taxes, exchange rates, rent and service eligibility can change the result.
One useful next step
Before trusting a cost comparison, write one sentence: “This number describes ___ people in ___ place during ___ period.” If the publisher cannot fill those blanks, the number is context—not a decision tool.