
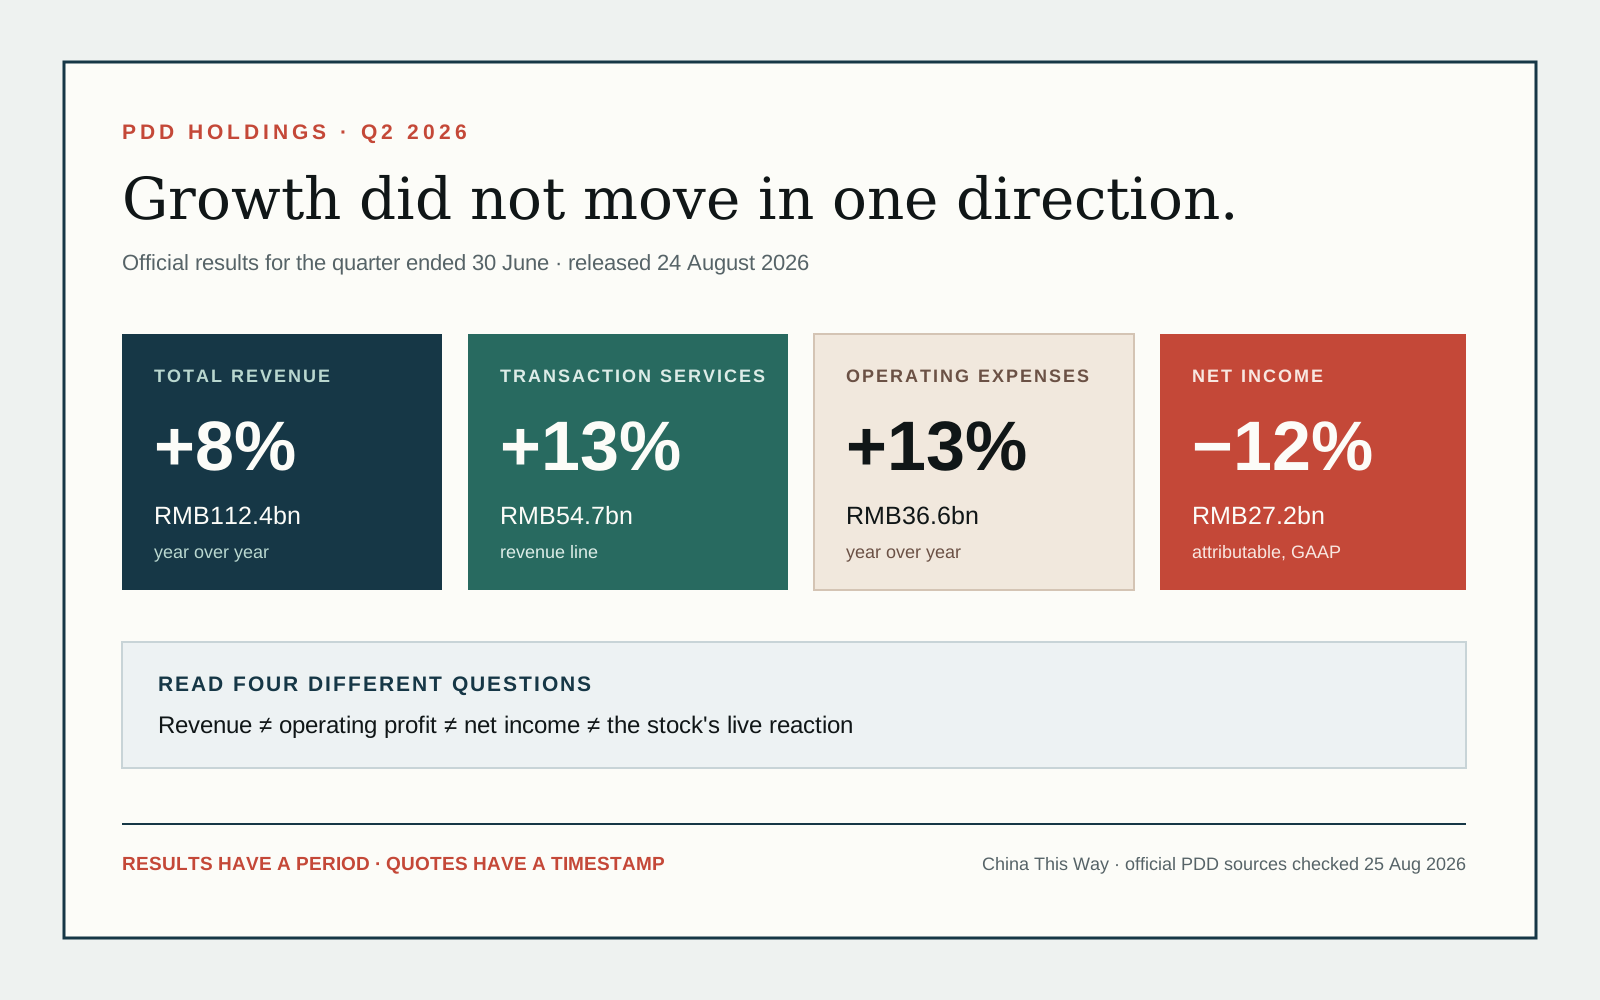
PDD Holdings reported higher revenue and operating profit for the second quarter of 2026, but lower net income. Revenue rose 8% year over year to RMB112.4 billion (US$16.6 billion), operating profit rose 8% to RMB27.8 billion, and net income attributable to ordinary shareholders fell 12% to RMB27.2 billion.
That is not a contradiction. Revenue, operating profit, net income, earnings per ADS and the stock’s minute-by-minute price answer different questions. This page keeps them separate and does not tell you whether to buy or sell PDD.
PDD Q2 2026 earnings: the short answer
| Metric | Q2 2026 | Year-over-year change | What it measures |
|---|---|---|---|
| Total revenue | RMB112.4bn / US$16.6bn | +8% | money recognized from the group’s services |
| Transaction services revenue | RMB54.7bn / US$8.1bn | +13% | transaction-service line, not gross merchandise value |
| Online marketing services and other revenue | RMB57.6bn / US$8.5bn | about +3% | marketing and related service revenue |
| Operating expenses | RMB36.6bn / US$5.4bn | +13% | sales and marketing, administration, and research and development |
| Operating profit | RMB27.8bn / US$4.1bn | +8% | profit after operating costs, before later items |
| Net income attributable to ordinary shareholders | RMB27.2bn / US$4.0bn | −12% | bottom-line profit attributable to ordinary shareholders |
| Diluted earnings per ADS | RMB18.45 / US$2.72 | down from RMB20.75 | GAAP diluted earnings for one PDD ADS |
The U.S.-dollar amounts are PDD’s convenience translations using RMB6.7851 to US$1. They are not a second set of independently reported accounts.
What is PDD stock—and is it the same as Temu?
PDD is the Nasdaq ticker for PDD Holdings’ American depositary shares. The company’s investor FAQ says the ADSs trade on the Nasdaq Global Select Market under PDD, and each ADS represents four Class A ordinary shares.
PDD Holdings is the company. Pinduoduo and Temu are its two named platforms in the company’s annual report:
- Pinduoduo is the mobile commerce platform primarily associated with mainland China.
- Temu is the group’s app-and-website marketplace operating across international markets.
- A PDD ADS is a security representing an interest in the holding company; it is not a Temu product, coupon or separate Temu stock.
This structure also explains why a Temu headline can affect interest in PDD stock without every quarterly number being disclosed separately for Temu. The published Q2 release reports consolidated PDD Holdings results and two revenue categories; it does not provide a standalone Temu income statement.
Why did PDD revenue rise while net income fell?
Because the lines between revenue and the bottom line changed by different amounts.
The reported sequence is:
- Total revenue increased from RMB104.0 billion to RMB112.4 billion.
- Total operating expenses increased from RMB32.3 billion to RMB36.6 billion.
- Sales and marketing expense rose from RMB27.2 billion to RMB29.7 billion.
- Research and development expense rose from RMB3.6 billion to RMB4.6 billion.
- General and administrative expense rose from RMB1.5 billion to RMB2.3 billion.
- Operating profit still increased, but profit after the remaining income, expense and tax lines was lower than a year earlier.
So “sales grew” and “net profit fell” can both be accurate. Revenue growth does not guarantee faster profit growth, and operating profit does not equal net income.
The release also reports RMB25.7 billion in operating cash flow, up from RMB21.6 billion, and RMB456.4 billion in cash, cash equivalents and short-term investments at 30 June 2026. Cash flow, cash balance and accounting profit are related, but none is a substitute for the others.
What changed inside PDD’s revenue mix?
Transaction services grew faster than online marketing services and other revenue:
| Revenue line | Q2 2025 | Q2 2026 | Change |
|---|---|---|---|
| Transaction services | RMB48.3bn | RMB54.7bn | +13% |
| Online marketing services and other | RMB55.7bn | RMB57.6bn | about +3% |
That mix is more informative than the group-level 8% alone. It shows where recognized revenue growth was concentrated. It does not reveal order volume, active buyer growth, merchandise value or Temu-only economics, because those figures are not supplied in this quarterly release.
GAAP versus non-GAAP: which PDD earnings number is real?
Both are reported, but they are not interchangeable.
| Measure | GAAP | Non-GAAP |
|---|---|---|
| Operating profit | RMB27.8bn, +8% | RMB29.1bn, +5% |
| Net income attributable to ordinary shareholders | RMB27.2bn, −12% | RMB28.5bn, −13% |
| Diluted earnings per ADS | RMB18.45 | RMB19.33 |
PDD says its non-GAAP measures exclude share-based compensation. The company also warns that non-GAAP figures are not a substitute for U.S. GAAP results. A headline should name which basis it uses; otherwise two different EPS numbers can look like an error when they are actually different definitions.
Why can PDD stock headlines disagree on the same day?
A headline can describe one of several snapshots:
- premarket reaction: trading before the regular Nasdaq session;
- opening move: the first minutes after the market opens;
- intraday move: a price at the article’s publication time;
- closing move: the final regular-session result;
- after-hours move: trading after the close;
- change from a different reference point: previous close, analyst expectation or an earlier low.
“PDD shares rose after earnings” can therefore be true at 8:30 a.m. Eastern Time while “PDD closed lower” is true later. Before trusting a percentage, check the timestamp, session, currency, reference price and whether the article was updated.
This page deliberately does not freeze a live stock quote into an evergreen explainer. A quote becomes stale; the official quarterly figures and the method for reading a reaction remain auditable.
What is the PDD stock price today?
Use a timestamped market source rather than a number copied into an article. PDD’s official investor stock-quote page embeds Nasdaq market data and labels it at least 15 minutes delayed. A brokerage may show a different value because it includes a later trade, extended-hours activity or a different data entitlement.
For any “PDD stock price today” result, verify:
- ticker
PDDand Nasdaq as the venue; - date, time and time zone;
- regular session versus premarket or after-hours;
- last trade versus bid, ask, open or previous close;
- whether the feed is delayed.
This page does not display a cached quote because that would answer a live query with a stale number.
Is PDD stock a buy or sell—and what is the forecast?
This page does not issue a buy, sell, hold, price target or stock-price prediction. A useful decision would require an investor’s time horizon, risk tolerance, portfolio concentration and view of facts the quarter does not resolve.
The evidence available here supports questions, not a guaranteed forecast:
- Can transaction-services revenue keep growing faster than the other revenue line?
- How much of the higher spending becomes durable platform growth?
- Why did the reported other-income line turn negative in the quarter?
- How do regulatory, trade and consumer-trust changes affect each market?
- What does PDD disclose about the economics of its platforms in later filings?
A price target that does not state its assumptions, date and author is not made reliable by adding a dollar sign. Readers looking for a forecast should compare named analysts’ dated models and conflicts of interest, then make their own decision or consult a qualified adviser.
When was the PDD earnings date and where is the call?
PDD released Q2 2026 results on 24 August 2026 and scheduled management’s earnings call for 7:30 a.m. U.S. Eastern Time that day. The official release links to the company’s investor-events page and says a webcast replay will remain available there after the call.
The company had not announced its next quarterly earnings date in the sources checked for this page. A calendar estimate is not an official date. Confirm the next event on PDD’s investor-relations site rather than treating an aggregator’s projected date as company guidance.
Did PDD beat earnings estimates?
The official release tells us what PDD reported, not whether it “beat” a particular consensus. A beat or miss requires all of the following:
- the exact metric—revenue, GAAP EPS, non-GAAP EPS or another measure;
- the consensus provider and analyst sample;
- the estimate timestamp before the release;
- consistent currency, ADS and accounting definitions.
Different data vendors can publish different consensus figures. Without naming the provider and timestamp, “PDD beat earnings” is incomplete. The source-checked answer here is the reported result: RMB112.4 billion revenue and RMB18.45 diluted GAAP earnings per ADS.
What the quarter can—and cannot—tell you about Temu
The report supports a group-level reading: revenue grew, transaction-services revenue grew faster, operating expenses rose, operating profit increased and net income declined. It does not isolate:
- Temu revenue or profit;
- U.S.-only order volume;
- customer-acquisition cost by country;
- tariff or de minimis effects as a quantified standalone line;
- a Temu valuation separate from PDD Holdings;
- the next day’s PDD share price.
Do not reverse-engineer an invented Temu profit figure from consolidated totals. For a broader explanation of why one app can sit over commerce, payments and services, see how a super-app becomes an operating layer. For the China-side relationship between app and embedded service, see how Weixin Mini Programs work.
Questions readers ask next
Why is PDD stock moving today?
PDD released Q2 2026 results on 24 August 2026. Revenue and operating profit rose 8% year over year, while attributable net income fell 12%. A live price move can also reflect expectations, guidance interpretation, market conditions and the exact trading-session timestamp; the earnings release alone does not prove one cause.
What was PDD’s Q2 2026 revenue?
RMB112.4 billion, translated by the company as US$16.6 billion, up 8% from RMB104.0 billion a year earlier.
Why did PDD profit fall?
Attributable net income fell 12% even though revenue and operating profit rose. Operating expenses increased 13%, and later income, expense and tax lines also sit between operating profit and net income. The page does not assign the decline to one unsupported cause.
Is PDD the same company as Temu?
PDD Holdings is the listed holding company. Its annual report names Pinduoduo and Temu as its platforms. There is no separate publicly traded “Temu stock” identified in the cited company filings.
Is PDD a Chinese stock?
The precise answer is more useful than the label: PDD Holdings is a Cayman Islands holding company with Pinduoduo and Temu platform operations, and its ADSs trade in the United States on Nasdaq under PDD. Its annual report describes contractual arrangements involving a PRC operating entity. Corporate domicile, operating exposure and listing venue are three different facts.
How many shares does one PDD ADS represent?
One PDD ADS represents four Class A ordinary shares, according to the company’s investor FAQ.
When was PDD’s latest earnings call?
The Q2 2026 call was scheduled for 7:30 a.m. Eastern Time on 24 August 2026. PDD’s release says the webcast replay is available through its investor-events page.
When is PDD’s next earnings date?
No next-quarter date was confirmed in the official sources checked on 28 August 2026. Dates shown by financial calendars may be estimates until PDD publishes an event notice.
Does this page predict PDD’s stock price?
No. It explains the official quarterly numbers and how to read time-sensitive market headlines. It provides neither a price target nor investment advice.
Sources and scope
- PDD Holdings: Q2 2026 unaudited financial results — official revenue, expense, profit, cash-flow, balance-sheet, EPS and currency-translation figures released 24 August 2026.
- PDD Holdings: 2025 Annual Report on Form 20-F — company, ADS, Pinduoduo, Temu and holding-structure definitions; filed 29 April 2026.
- PDD Holdings: Information for Investors — Nasdaq ticker and ADS-to-Class-A-share ratio.
- PDD Holdings: Stock Quote & Chart — company investor page embedding market data and disclosing a minimum 15-minute delay; not a real-time execution quote.
This page was checked on 28 August 2026. Financial figures are copied from PDD’s unaudited release and labelled by accounting basis. It is an explanation of a China-founded commerce group for U.S. readers, not individualized financial advice, a valuation model or a live quotation service.